
Measure content marketing by following one defined audience from reach to a meaningful business event. Give every stage its own event, denominator, time window, and system of record, then stop the claim where the evidence stops.
A traffic report cannot do that job. It can tell you that a page earned impressions, clicks, or visits. It cannot tell you whether the visitor reached value, matched your buyer, entered a sales process, or became revenue without product, CRM, and billing evidence.
What should a content marketing funnel measure?
A content marketing funnel should measure movement from an observable exposure to a defined business event without treating the early signal as proof of the later one.
Use this seven-stage ladder:
| Stage | Mechanical event | Denominator | System of record | Claim you may make |
|---|---|---|---|---|
| Reach | Search impression or recorded AI answer | Eligible query impressions or preserved prompt runs | Search Console or answer-observation system | The content or company appeared in this measured surface |
| Visit | Landing-page session or user | Reached audience for that source and period | Web analytics | A measured person or browser reached the site |
| Action | CTA click or asset interaction | Eligible page users | Web analytics or product analytics | A visitor took the defined next step |
| Start | Account, scan, trial, demo, or workflow start | CTA actors or eligible visitors | Product analytics or CRM | A person began the intended process |
| Activation | First credible value event | Starts in a named cohort | Product analytics | A starter reached the defined value moment |
| Qualification | Account meets fit and intent rules | Activated or created accounts | CRM and sales process | An account met the stated qualification rule |
| Revenue | Closed-won, paid, retained, or expanded value | Qualified cohort or customers | CRM and billing | Revenue occurred in the measured cohort |
The table is intentionally strict. A search impression is reach. A visit is traffic. A CTA click is behavior.
An activated account is product value. A qualified opportunity is commercial evidence. Revenue is revenue.
Several Trovance pieces already separate visibility, clicks, and revenue in AI-search analysis. None owned the general operating ladder a lean team can use across its whole content program.
Why does a traffic report stop too early?
A traffic report stops at the site boundary, while the business decision usually happens after it.
Google's Search Console documentation defines clicks as visits from Google Search, impressions as appearances in results, and CTR as clicks divided by impressions. Average position reports the topmost site result under Google's counting rules. Those are useful search-performance measures. They are not customer outcomes.
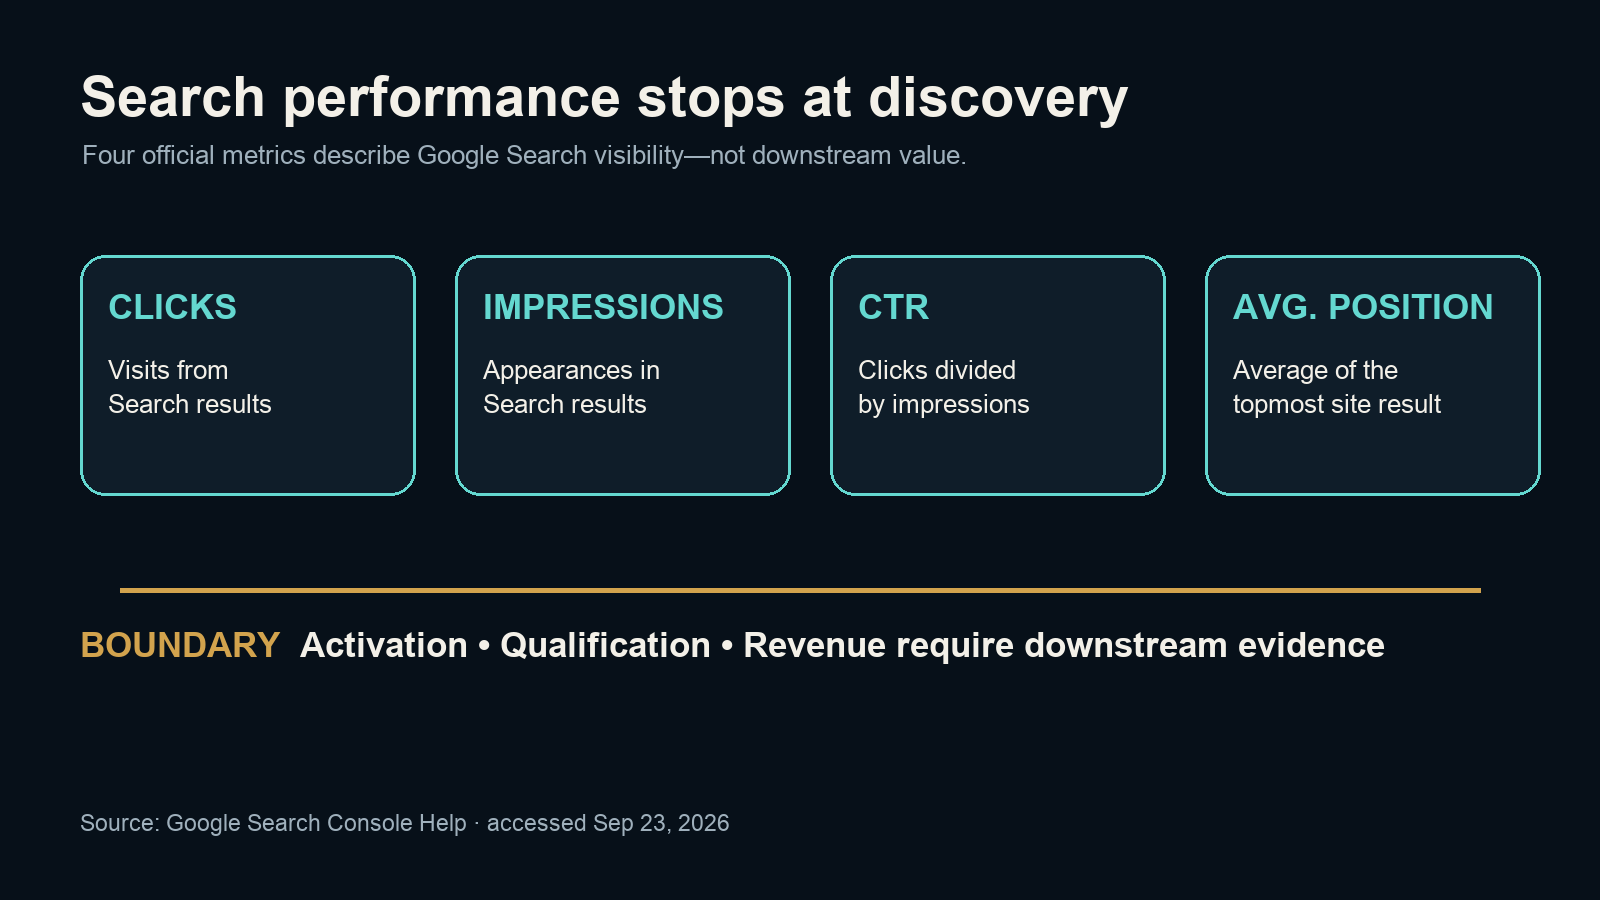
Source: Original Trovance editorial diagram based on Google Search Console Help, accessed September 23, 2026. The four documented metrics describe Google Search performance; the downstream boundary is our analysis.
The same report supports six table dimensions: query, page, country, device, search appearance, and date. That helps isolate where discovery changed. It still does not identify whether a click came from an ideal customer, whether the page solved the reader's problem, or whether the account progressed.
Even the denominator needs care. Search Console's default view covers the previous three months, while its time controls include four granularities: hourly, daily, weekly, and monthly. Google labels the newest 24-hour view as preliminary data.
A weekly impression trend and a quarterly pipeline cohort are different units. Putting them on one slide does not make them comparable.
How should you define activation and qualification?
Define activation as the first event that proves the user received credible value, then define qualification as a separate account-level judgment about fit and intent.
For Trovance, a weak event would be "report generated." A stronger candidate would require the team to inspect a real answer or source pattern, accept or refine the diagnosis, and identify a justified next action. The exact production event still needs first-party product validation before it becomes canonical.
For another product, activation might be an invited teammate completing a shared workflow, a connected data source producing an accepted result, or a campaign launching successfully. The wording changes. The test does not: could the event happen while the user receives no meaningful value? If yes, it is probably setup or usage rather than activation.
Qualification belongs later because product value and commercial fit are not identical. A user may activate and still be too small, outside the supported market, unable to publish proof, or unwilling to adopt the workflow. A qualified account needs a named rule such as company fit, use case, intent signal, owner, and next commercial step.
How do funnel rules change the result?
Funnel rules change who enters the denominator, which sequence counts, and how much apparent drop-off the report shows.
Google Analytics permits two funnel modes. An open funnel lets a user enter at any step. A closed funnel requires entry at the first step. GA4 counts only steps completed in the specified order, and one user enters the reported funnel once during the selected date range.
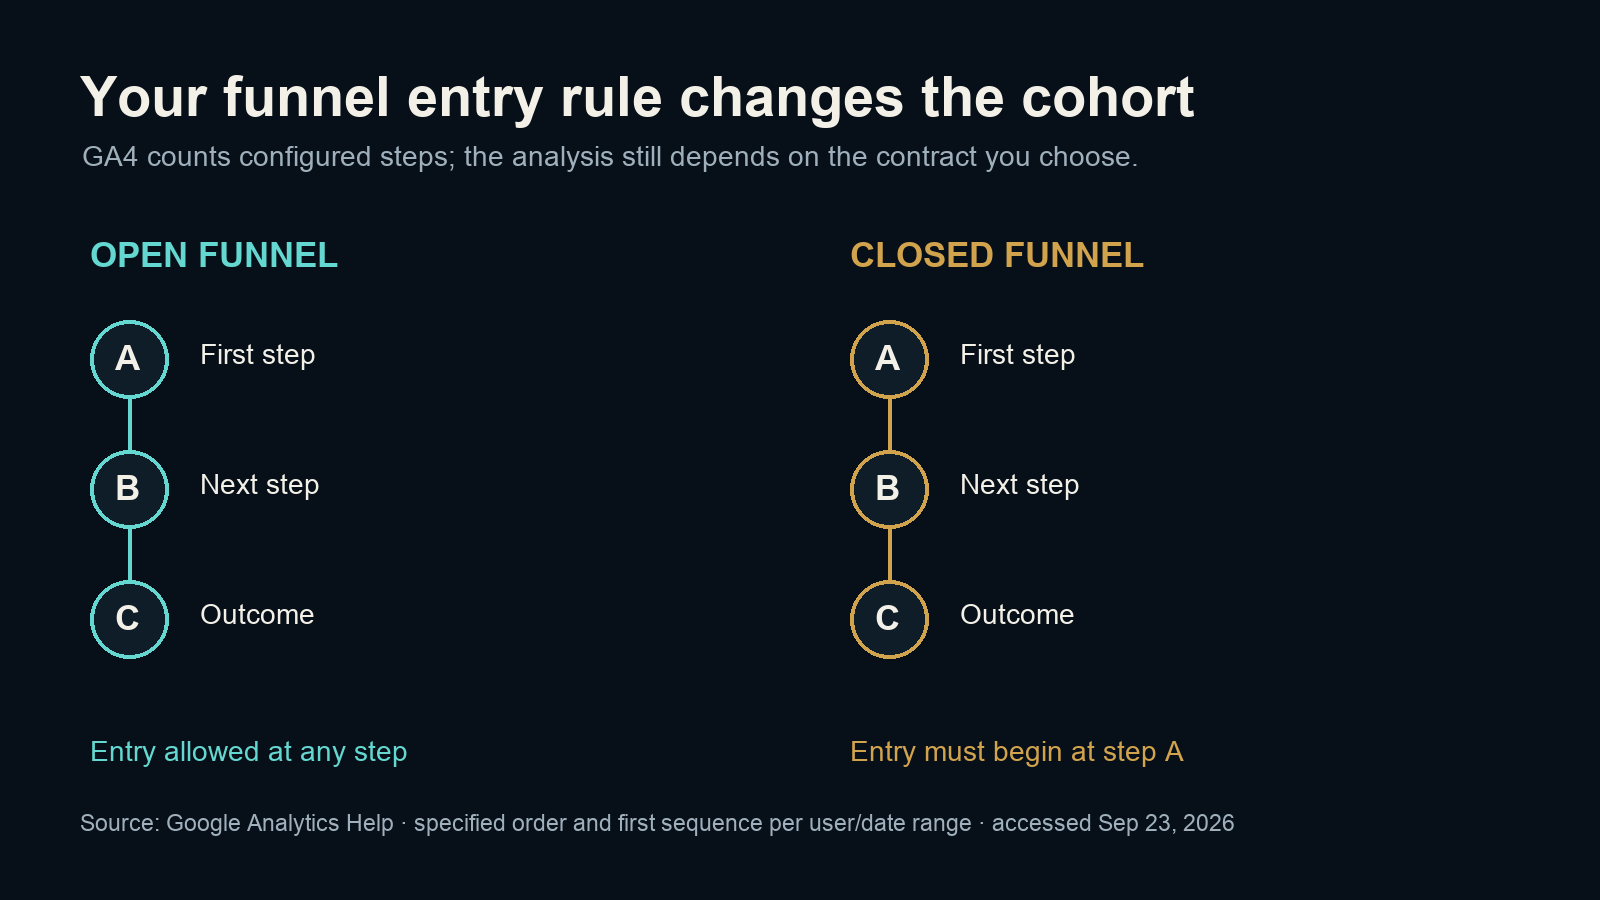
Source: Original Trovance editorial diagram based on Google Analytics Help, accessed September 23, 2026. Entry and sequence rules alter the counted cohort; they do not choose the business definition for you.
Google's worked example uses two configured funnels and four users. The open funnel counts all four at their first eligible step. The closed funnel counts only users 1 and 3 because they reached step A.
Same activity. Different entry contract. GA4 can also show the five most common next actions after each step, but the report still depends on the event definition.
This matters for content. If the funnel starts at an article session, you exclude buyers who read an AI answer, saw a social excerpt, returned directly, or entered through a product page. If it is open, you can include downstream actors, but you cannot claim the article reached them without a joinable exposure record.
I read both Google help pages in the browser and compared the counting language before building the ladder. The most useful detail was not the maximum of 10 funnel steps. It was Google's warning, embodied in the example, that entry and sequence rules change the population being reported.
Which metrics belong on the weekly scorecard?
The weekly scorecard should show one measure per funnel stage, its denominator, the current cohort, and the decision the team will make from it.
A lean B2B team can start here:
| Question | Weekly measure | Decision triggered |
|---|---|---|
| Are the intended questions finding us? | Impressions or preserved answer appearances by query set | Fix access, relevance, or evidence coverage |
| Are people reaching the owned answer? | Landing-page users by source and content cluster | Improve distribution, title, summary, or internal path |
| Does the page create useful motion? | CTA actors divided by eligible page users | Fix the next step or the page-to-product bridge |
| Do starters receive value? | Activated accounts divided by starts within the agreed window | Fix onboarding, diagnosis, or product workflow |
| Are the right accounts progressing? | Qualified accounts divided by activated accounts | Revisit ICP, offer, handoff, or sales follow-up |
| Does the cohort create business value? | Revenue, retention, or expansion for the named cohort | Compare contribution, cost, and opportunity |
Keep the numerator and denominator beside each percentage. "Activation rose" is not reviewable without the cohort, event definition, window, exclusions, and prior basis of comparison.
GA4 can display two visualization forms, standard and trended, and can compare up to four segments. Those controls help an analyst inspect behavior. They do not choose the activation event, validate the CRM stage, or decide whether a content touch deserves credit.
What can you honestly attribute to content?
You can attribute an observed touch under a declared model; you usually cannot prove that the touch caused the outcome.
Separate four statements:
The person or account was exposed to a measured content asset.
The person or account later completed an action.
The attribution model assigned some credit to the touch.
The content caused the action.
The first three may be observable. The fourth needs a stronger design, such as a credible holdout, randomized test, natural experiment, or careful matched comparison. First-touch and last-touch models choose a bookkeeping rule. They do not reveal the counterfactual.
The practical fix is not to abandon measurement. Report contribution with the attribution rule attached: "Among accounts with a recorded resource touch in this 90-day cohort, X reached activation and Y became qualified under our current definition." Then list missing exposures, identity gaps, sales influence, campaign overlap, and other confounders.
Public views, likes, engagement, model mentions, and citations fail closed here. Without a cohort, denominator, observation window, and attribution method, they are distribution evidence rather than acquisition or revenue proof.
How does Trovance connect AI visibility to the measurement funnel?
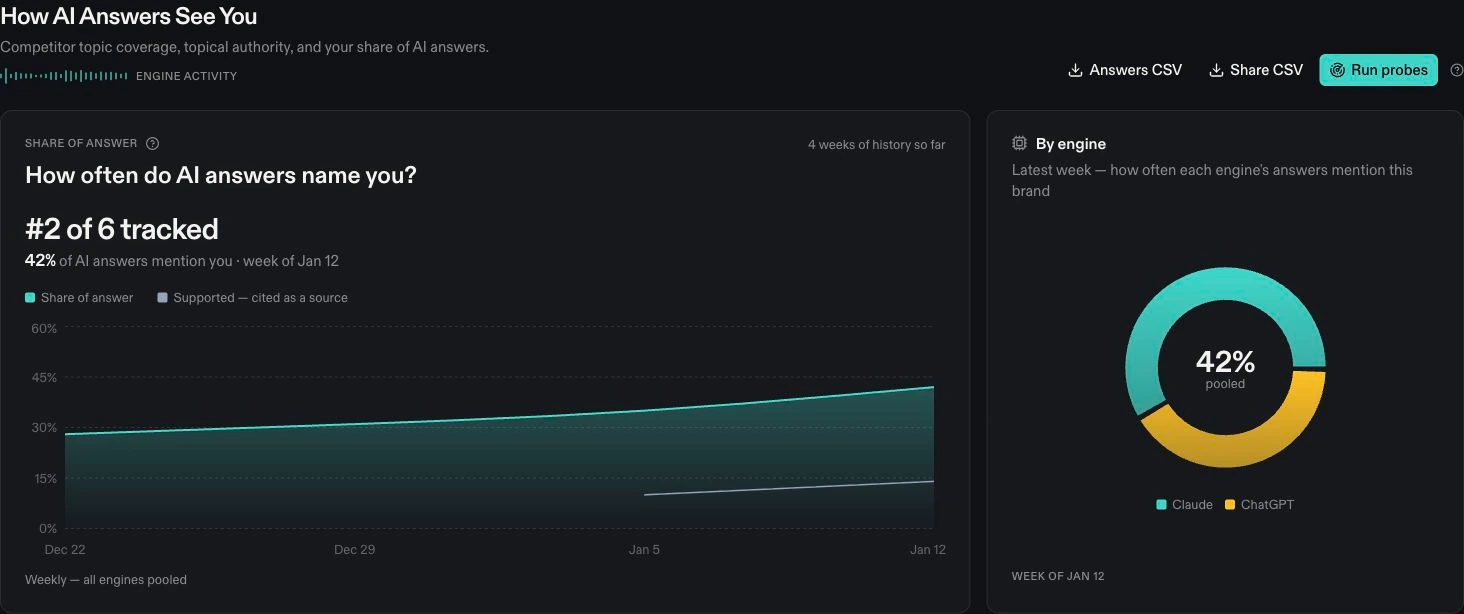
Trovance supplies the observed-answer, referral, and evidence-action layer at the top of this measurement funnel. It lets your team inspect how AI systems explain, cite, compare, and recommend your company, then follow identifiable AI referrals and on-site events with the evidence for each measure in view. That gives the reach and visit stages a reviewable record instead of a blended visibility score.
From there, Trovance helps diagnose the evidence gap behind an answer and move the justified response toward a proof-backed asset. Your product analytics, CRM, and billing records continue the chain through activation, qualification, and revenue. The useful outcome is a cleaner handoff: observed AI evidence on one side, downstream business events on the other, and no need to pretend that a mention is a sale.
A human still reviews whether the diagnosis is supported, whether the evidence is publishable, and which action belongs in the measurement plan. That keeps the article's central rule intact: name the event, denominator, time window, and system of record before making the claim.
Start your free trial to establish the first observed layer, then connect any resulting asset to the same event and cohort definitions used in the rest of your funnel.