
Measure AI search visibility as six separate signals: mentions, citations, comparisons, recommendations, traffic, and business outcomes. Keep each numerator and denominator visible, and never average the six into one number, because each movement asks for a different response.
Start with a stable set of buyer questions. Preserve the raw answers and sources, rerun them under a declared method, then connect identifiable visits and qualified outcomes through your existing analytics.
Which measurement problem sounds like yours?
Your first job is to recognize what is broken in the current report.
Most teams we see on paper would fall into one of these situations:
The score moved, but nobody can say whether mentions, citations, or recommendations changed.
The company appears often, but the answers describe it inaccurately or compare it against the wrong alternatives.
Referral traffic rose, but the analytics report does not show qualified starts, opportunities, purchases, or retained accounts.
A before-and-after chart looks convincing, but the prompt set, model version, repeated-run rule, or denominator changed.
Those are different problems. The first is a reporting problem. The second may be an evidence, positioning, product, reputation, or fit problem.
The third needs business analytics. The fourth may make the trend unusable.
I checked the current IAB framework before building this scorecard. Its model separates Presence, Prominence, Portrayal, and Persuasion, which is already more honest than a universal score. The practical addition is to carry the measurement into identifiable traffic and business outcomes without pretending the chain is causal.
Which AI visibility signals belong in the dashboard?
The dashboard should have six rows, each with its own numerator, denominator, and decision use.
Signal | What to count | Denominator | What the movement can trigger |
|---|---|---|---|
Mentions | Eligible responses that name the company | All eligible responses in the panel | Check identity, relevance, category fit, and prompt coverage |
Citations | Eligible responses that link or attribute to the company | All eligible responses in the panel | Inspect source access, source choice, and evidence quality |
Comparisons | Eligible comparison answers that include the company and preserve material facts | All eligible comparison answers | Repair stale facts, unclear tradeoffs, or wrong comparison evidence |
Recommendations | Eligible recommendation answers that choose the company for a declared job | All eligible recommendation answers | Test buyer fit, supportable proof, limitations, and outside reputation |
Traffic | Identifiable sessions under a declared analytics classification | All classified sessions, or channel sessions, in the period | Inspect landing behavior and declared on-site actions |
Outcomes | Qualified starts, opportunities, retained accounts, or revenue | The corresponding eligible cohort | Decide whether the work is tied to a business result worth funding |

Source: IAB.
IAB's figure names 4 groups for brands. Presence includes mention rate and citation rate. Prominence covers position.
Portrayal covers sentiment, framing, hallucination rate, and factual inaccuracy rate. Persuasion includes recommendation strength and post-citation click-through rate.
Treat the figure as a taxonomy, not proof that one layer causes the next. IAB says its persuasion measures bridge toward a forthcoming attribution framework. The current document does not establish that a mention creates a recommendation or that a recommendation creates revenue.
The six-row scorecard keeps that boundary visible. Model-side signals describe observed answers. Traffic describes identifiable visits. Outcomes describe behavior in product, CRM, commerce, or finance systems.
How should you define each signal?
Define every signal before collecting data, especially the inclusion rule and denominator.
Mention rate can be responses that name the company / all eligible responses. Citation rate can be responses that cite the company / all eligible responses. If one report divides by all answers and another divides only by answers containing citations, the percentages cannot be compared cleanly.
Comparison and recommendation need narrower panels. A company omitted from an informational answer is not the same as a company omitted from a shortlist prompt.
IAB asks directional programs to cover at least 2 intent types and decision-grade programs to cover all 4 named intents: informational, comparison, recommendation, and transactional.
For each run, preserve:
platform and model or surface;
exact prompt sequence and buyer context;
prompt intent and eligibility rule;
raw answer, cited URLs, company facts, and named alternatives;
date, repeated-run count, and any method or baseline change;
numerator, denominator, and uncertainty or normal variation.
IAB treats programs with fewer than 50 queries as exploratory. That number is a floor inside IAB's framework, not a magic sample size. Crossing it does not prove the panel represents your buyers, and IAB does not supply one universal repeat count for every platform or metric.
A lean team can begin with a smaller exploratory panel if it labels the work honestly. Use it to inspect patterns and improve the protocol, not to move a large budget or declare a market win.
What should you do when one signal moves?
Use the changed signal to decide what to inspect next instead of reaching for the same content tactic every time.
If this describes you | Check this | Take this action |
|---|---|---|
Mentions fell across one platform | Model change, prompt mix, identity language, category fit | Hold the content queue until you know whether the panel or market explanation changed |
Citations fell while mentions stayed stable | Cited URLs, access, freshness, source competition, claim support | Repair the source or evidence trail that failed; do not rewrite unrelated pages |
Comparisons are inaccurate | Product facts, dates, limitations, alternatives, conflicting pages | Correct the owned comparison or product evidence and remove stale contradictions |
Recommendations are weak but descriptions are accurate | Buyer constraints, real fit, outside proof, offer quality | Strengthen supportable proof, improve the offer, or accept legitimate bad fit |
Traffic rose without qualified outcomes | Landing page, event definitions, cohort quality, CRM or product records | Treat the traffic as an observation and investigate conversion separately |
Outcomes rose while visibility signals stayed flat | Other channels, sales activity, pricing, product changes, attribution model | Do not credit AI visibility without a stronger exposure and causal design |
The middle two routes need human judgment. A model may describe a company accurately and still recommend someone else because the prompt describes a poor fit. Publishing more pages to force that recommendation would make the measurement less truthful, not more useful.
Keep the complete answer and method on the owned canonical page at trovance.ai. Social posts can distribute the framework or show one example, but they should not become competing canonical articles. A public view or engagement count is distribution evidence, not acquisition or revenue proof.
How should traffic and outcomes stay separate?
Traffic and outcomes should remain separate because an identifiable visit, a declared event, a qualified account, and revenue are different observations.
GA4 currently defines an AI Assistant channel and names 5 examples: ChatGPT, Gemini, Deepseek, Copilot, and Grok. Google's 2 AI search surfaces, AI Overviews and AI Mode, remain under Organic Search rather than AI Assistant.
That classification is useful, but it is not a complete exposure log. It misses assistant research that sends no click, arrives without an identifiable referrer, or continues through another device or a later branded search.
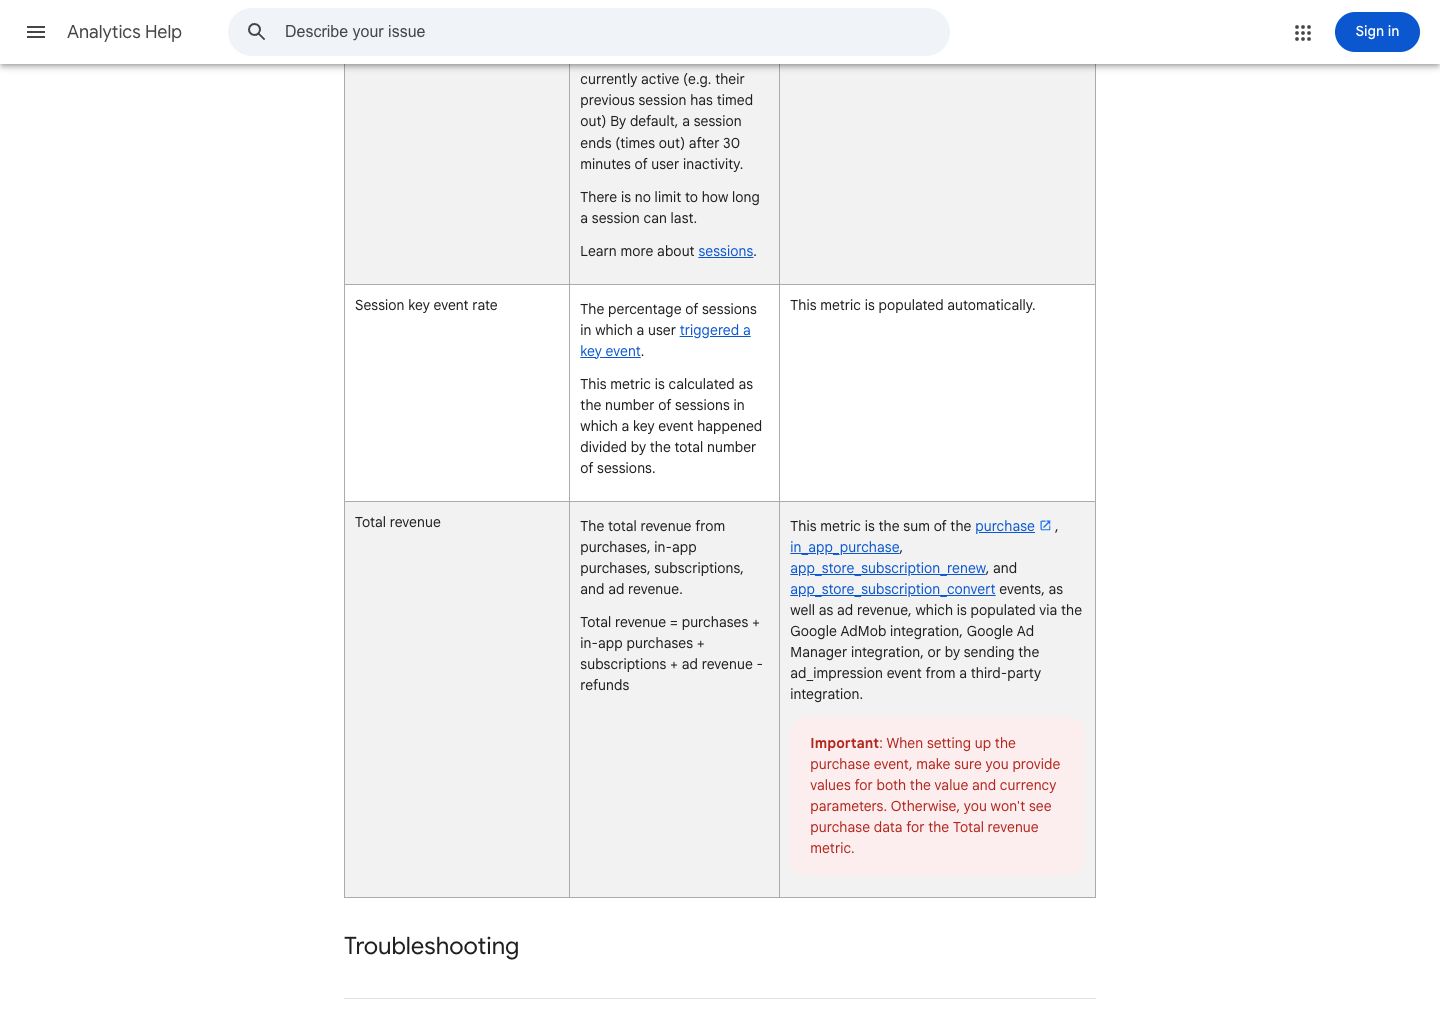
Source: Google Analytics Help.
Google defines session key event rate as sessions with a key event divided by total sessions. Its Total revenue metric combines purchases, in-app purchases, subscriptions, ad revenue, and refunds under documented event rules. The page also says purchase events need both value and currency to populate revenue correctly.
I opened the current Google metric table in a public browser and checked the event-rate and revenue rows together. The formulas are clear. They still do not tell you whether an AI answer caused the visit or whether the revenue would have happened without it.
Report the raw count beside every rate. Two qualified starts from 20 classified sessions is more useful than 10% conversion without the numerator. Then preserve the property, period, channel dimension, event definition, qualification rule, attribution method, and known tracking gaps.
What can the six signals actually prove?
The six signals can document observed answers, identifiable visits, and recorded business behavior under declared methods. They cannot turn correlation into causation or replace judgment about fit, evidence, and action.
Evidence state | What you can say | What remains outside the signal |
|---|---|---|
Observed | A preserved answer mentioned, cited, compared, or recommended the company under recorded conditions | Hidden reasoning, all buyer exposure, and future model behavior |
Inferred | A repeated pattern may indicate an identity, evidence, comparison, reputation, or fit issue | The cause of the pattern without further investigation |
External analytics | A classified session, qualified action, or revenue event occurred under a declared system | The full assistant conversation and causal incrementality |
Human judgment | The team decided whether the claim is true, the fit is real, and the response is justified | A guaranteed ranking, citation, recommendation, or revenue outcome |
A mention is not a citation. A citation is not a comparison. A comparison is not a recommendation. A recommendation is not a visit, and an attributed sale is not automatically an incremental sale.
Run-to-run variation belongs in the report too. IAB asks decision-grade providers to define acceptable variation inside a 7-day window, preserve per-platform results, and disclose collection methods. A point estimate without its protocol is a screenshot, not a decision system.
Public views, likes, reposts, and comments cannot support acquisition or revenue claims without a defined cohort, denominator, attribution method, and observation window. Use those counts to evaluate distribution on that platform, nothing more.
How can Trovance measure the gap without hiding it in one score?
Trovance can preserve the answer-level evidence behind the first four signals, then connect the diagnosis to the proof-backed asset that should exist.
A team uses Trovance to observe how AI systems explain, cite, compare, and recommend the company. It can then diagnose whether the gap looks like identity, stale evidence, weak comparison language, outside reputation, technical access, product fit, or legitimate bad fit. A score alone cannot make that decision.
When the evidence supports a public asset, Trovance helps produce and publish it with the source trail intact. Traffic, qualification, retention, and revenue still belong in the team's analytics, product, CRM, and financial systems, with people responsible for the interpretation.
Start with a preserved visibility baseline before connecting changes to traffic, leads, or revenue. Start your free trial.