Verdict: Pew Research Center observed much lower traditional-result click rates on Google result pages classified as having an AI summary. That is useful evidence of an association. It is not proof that the summary caused the gap, and it does not tell your team which page, query, or customer journey needs attention.
This distinction matters because the wrong diagnosis produces the wrong work. A lower sitewide click-through rate could reflect changing query mix, rank, device mix, result design, or an AI feature. Before rewriting pages or declaring that search is dead, separate exposure, clicks, post-click behavior, and business outcomes. The goal is not to dismiss the study; it is to act at the level the evidence supports.
What did Pew observe about AI Overviews and clicks?
Pew observed traditional-result clicks on 8% of visits classified with an AI summary and 15% of visits without one. It also found a click on a source inside the summary on 1% of summary-page visits. Those figures describe the visits in the study; they do not establish a universal current benchmark.
The analysis covered 68,879 unique Google searches from the March 2025 browsing activity of 900 U.S. adults in KnowledgePanel Digital. Pew reported that 12,593 of those searches produced an AI summary when the research team later collected the corresponding result pages. The sample and weighting make this more useful than an anecdote, but they do not turn an observational comparison into an experiment.
Evidence at readable size. Swipe or scroll horizontally to read all columns; keyboard users can focus the image and use arrow keys.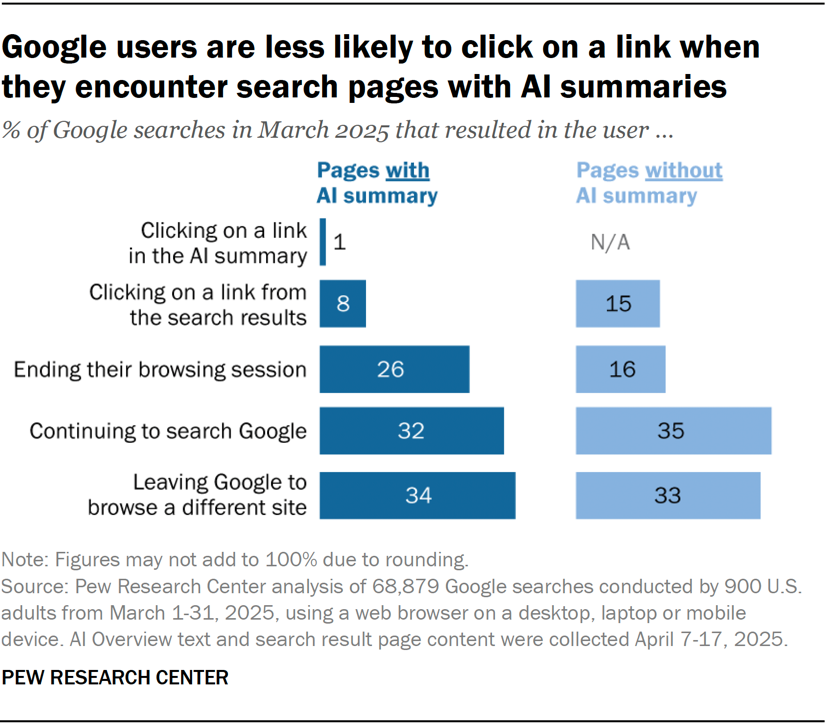 Source: Pew Research Center's analysis of Google search behavior.
Complete research figure reproduced for analysis; labels and methodological footnote retained.
The important denominator is visits, not people, pages, or a publisher's lost traffic. The 8% and 15% figures compare how often a traditional result was clicked in two groups of visits. They do not say that every site lost 47% of its clicks, nor do they identify the clicks any particular brand would have received without the summary.
The 1% figure needs the same care. It is the share of visits to result pages with an AI summary in which a user clicked a link inside that summary. It is not a 1% click-through rate for a specific cited URL, and it does not describe all result interactions.
Why doesn't the click gap prove that AI Overviews caused it?
The study compared naturally occurring visits rather than randomly assigning equivalent searches to result pages with and without an AI summary. That leaves competing explanations open. More importantly, Pew paired March browsing behavior with result pages rerun and collected from April 7 to April 17, after the original visits.
Pew states that the AI summary for a search may change over time and that its analysis reflects how results appeared when they were collected. That is a transparent methodological limitation. It means the classification was based on a later reconstruction, not a saved image of the exact result page each participant saw before clicking.
Three boundaries follow:
- The groups differed. AI summaries were not randomly distributed across identical queries.
- The exposure was reconstructed. A query classified with a summary in April may not have displayed the same result in March.
- The outcome was behavioral, not counterfactual. We can see what happened in observed visits, but not what the same person would have done on the same visit without the summary.
That does not erase the result. It changes the claim from 'AI Overviews caused clicks to fall' to 'visits associated with an AI summary had lower click rates in this dataset.' The second statement is still important. It is simply more precise.
How did query mix differ when an AI summary appeared?
AI summaries appeared more often for longer and question-shaped searches in Pew's reconstructed result set. Those searches may carry different intentions and stopping behavior than shorter searches, even before considering the result feature. Query mix is therefore part of the comparison, not background noise that can be ignored.
Evidence at readable size. Swipe or scroll horizontally to read all columns; keyboard users can focus the image and use arrow keys.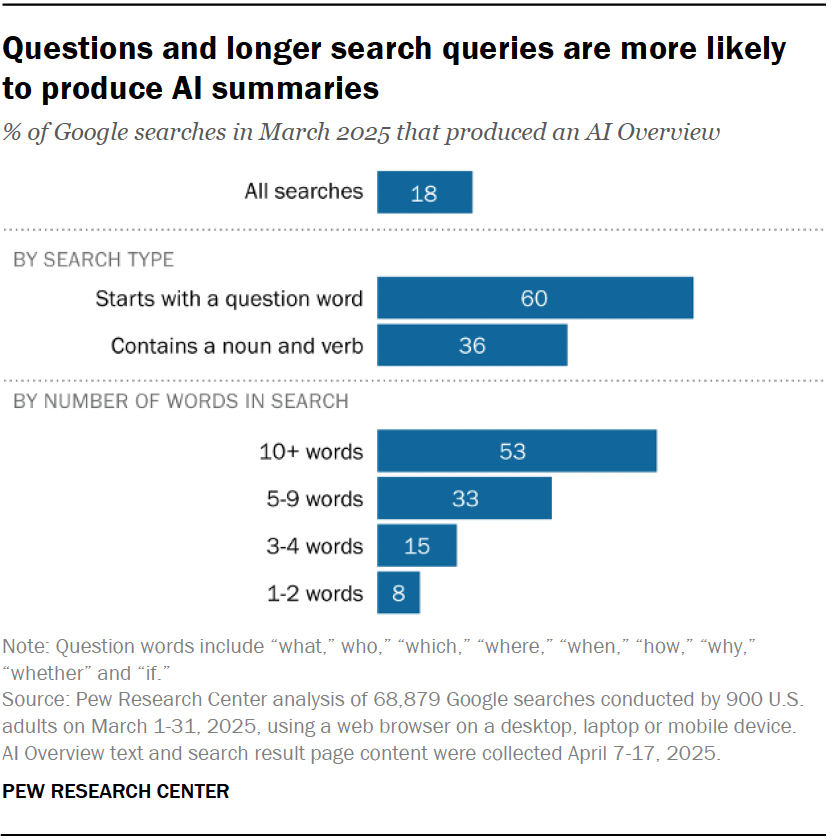 Source: Pew Research Center's analysis of Google search behavior.
Complete research figure reproduced for analysis; labels and methodological footnote retained.
The chart shows why a single blended click rate is a weak operating instruction. A seven-word question asking for an explanation is not the same reader job as a one-word brand query. One may be satisfied by a concise answer; the other may still lead directly to a destination. Device, position, result type, and brand familiarity can add more differences.
For your own analysis, begin with query families instead of one sitewide average. Group questions that ask for a definition, comparison, recommendation, procedure, or brand destination. If impressions or clicks shift, inspect whether the mix of those jobs changed. A blended decline can be real while the proposed explanation remains wrong.
This is also why retrieval, citation, comparison, and recommendation should be measured separately. A page can be retrieved without being cited, cited without earning a click, or clicked without creating a qualified opportunity. Collapsing those stages hides the first useful intervention.
What can Search Console tell you about the decline?
Search Console can show observable performance events such as impressions, clicks, average position, and click-through rate. Google defines click-through rate as clicks divided by impressions. Those records help locate a change, but they do not identify whether an AI summary caused it or whether the resulting visits produced business value.
Use four separate records:
| Stage | Evidence to preserve | What it can support | What it cannot prove |
|---|---|---|---|
| 1. Exposure | Query or page impressions, device, country, date and average position | A search result associated with the site was seen under Google's metric rules | That the user noticed the listing or an AI answer used the page |
| 2. Click | Search clicks, CTR and landing page | A user clicked from Google to the site | Why the user clicked, why another user did not, or which result feature caused the rate |
| 3. Post-click | Engaged sessions, key events and landing-page paths under your analytics definitions | What tracked visitors did after arrival | The outcome of people who never visited or complete cross-device behavior |
| 4. Business | Qualified enquiries, opportunities and revenue under a declared attribution rule | Whether tracked activity reached a commercial result | A single search feature's causal contribution without a stronger design |
Do not force these sources into one false-precision score. A position decline asks for a different investigation from stable impressions with lower clicks. Stable clicks with worse lead quality ask for a different investigation again. A useful AI visibility benchmark keeps the observed metric attached to its decision instead of presenting one number as a diagnosis.
What should you do when the evidence changes?
Choose the action that matches the first stage with credible evidence of a problem. If you do not have a reliable baseline, the correct action can be to improve the measurement rather than change the content. 'No action yet' is a valid outcome when the mechanism remains unknown.
- Exposure changed: check indexing, position, query mix, device, country, and page eligibility before rewriting the article.
- Clicks changed while exposure stayed comparable: inspect the actual result page, title, snippet, competing results, and answer features for the affected query family.
- Post-click behavior changed: inspect landing-page fit, speed, message continuity, and conversion instrumentation.
- Business outcomes changed: verify lead definitions and attribution scope before assigning the difference to search.
- AI answers are inaccurate or omit important proof: inspect the answer's cited sources and decide whether the source content, site content, or positioning needs repair.
Preserve the date and context of every observation. Search results change, analytics definitions change, and answer systems can return different wording. A screenshot without the question, date, engine, account context, and cited URLs is difficult to compare later.
A useful observation plan can be simple: choose a bounded set of buyer questions, capture the full answer and cited sources, record the matching search and site metrics, and review them on a consistent schedule. The plan is an editorial recommendation, not a promise that a fixed number of observations will isolate causality.
If the evidence points to missing or inconsistent facts, fix source consistency before producing more generic copy. If it points to an incorrect answer, use the cited-source chain to diagnose the discrepancy. Neither action should be prescribed from a sitewide CTR chart alone.
How does Trovance help you investigate AI-search click changes?
Trovance helps lean marketing teams move from an ambiguous score to the evidence behind the next decision. Start with the buyer questions that matter to the business. We preserve observed answers and their cited sources so your team can inspect what the system said, which source appears to support it, and whether the description matches the offer. That evidence sits beside the measurement question rather than being converted into a guaranteed attribution claim.
This is the system after the score. When a click or visibility metric changes, the useful next step may be a source correction, a clearer product page, a retrieval check, a positioning decision, or no content change at all. Trovance makes those paths easier to separate. Your team keeps the question, answer, source chain, and decision rationale together, then follows up with the relevant owner instead of assigning every difference to 'AI traffic.'
Text Trovance with one buyer question and the evidence you already have. The next step is a focused diagnosis, not another dashboard for your team to maintain.